
Liberation Day
Trump told us it was coming. April 2, 2025. Tariffs on the entire world. The date was public. The intent was public. What the market would do about it was not. I wore a dress shirt to work that day. My coworkers asked how my interview went. "Short".
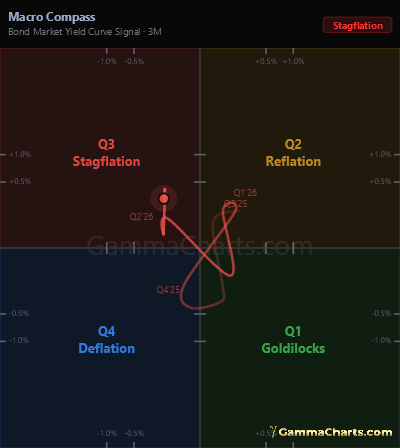
The market was already bleeding. Q1 rotation. Weak vanna flows (the dealer bid that normally supports prices), with few hedges to unwind. The slow sell-off that starts on opex (options expiration) and accelerates into quarter-end. Liberation Day was not the cause. It was the last thrust.
I had the tools. Not GammaCharts yet, but the same data. The same read on the field. Options flow does not predict the future. But it shows you the regime. The bias. Where hedging amplifies. Where flows exhaust.
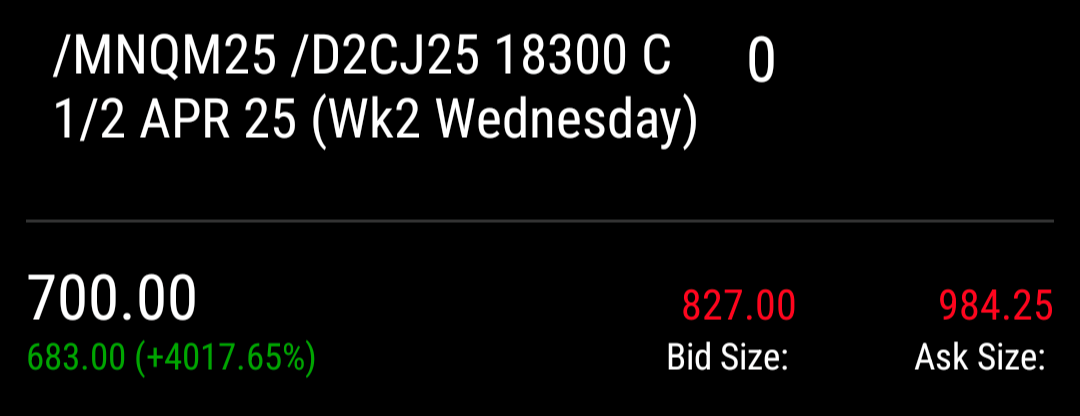
One-day OTM puts. Several thousand percent down. The low hit right on quarterly roll.
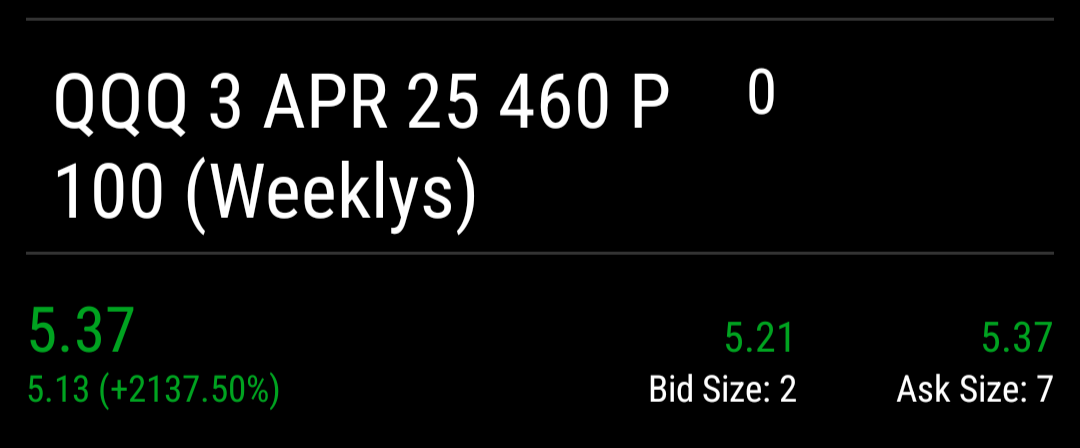
Not a coincidence. Flows. Several thousand percent back up. More, actually.
Note: Markets are risky, this is not financial advice.
The domain is the moat
AI didn't raise the floor on engineering. It raised the ceiling on domain ownership.
I have been a real estate agent, a game developer, and now I build quantitative finance tools. In every field, I do the same thing: immerse until I have the 60,000-foot view. The code follows. It always does.
With agents building full-stack apps in a weekend, the code is no longer the bottleneck. The knowledge that lives outside the codebase is. The domain is the moat.
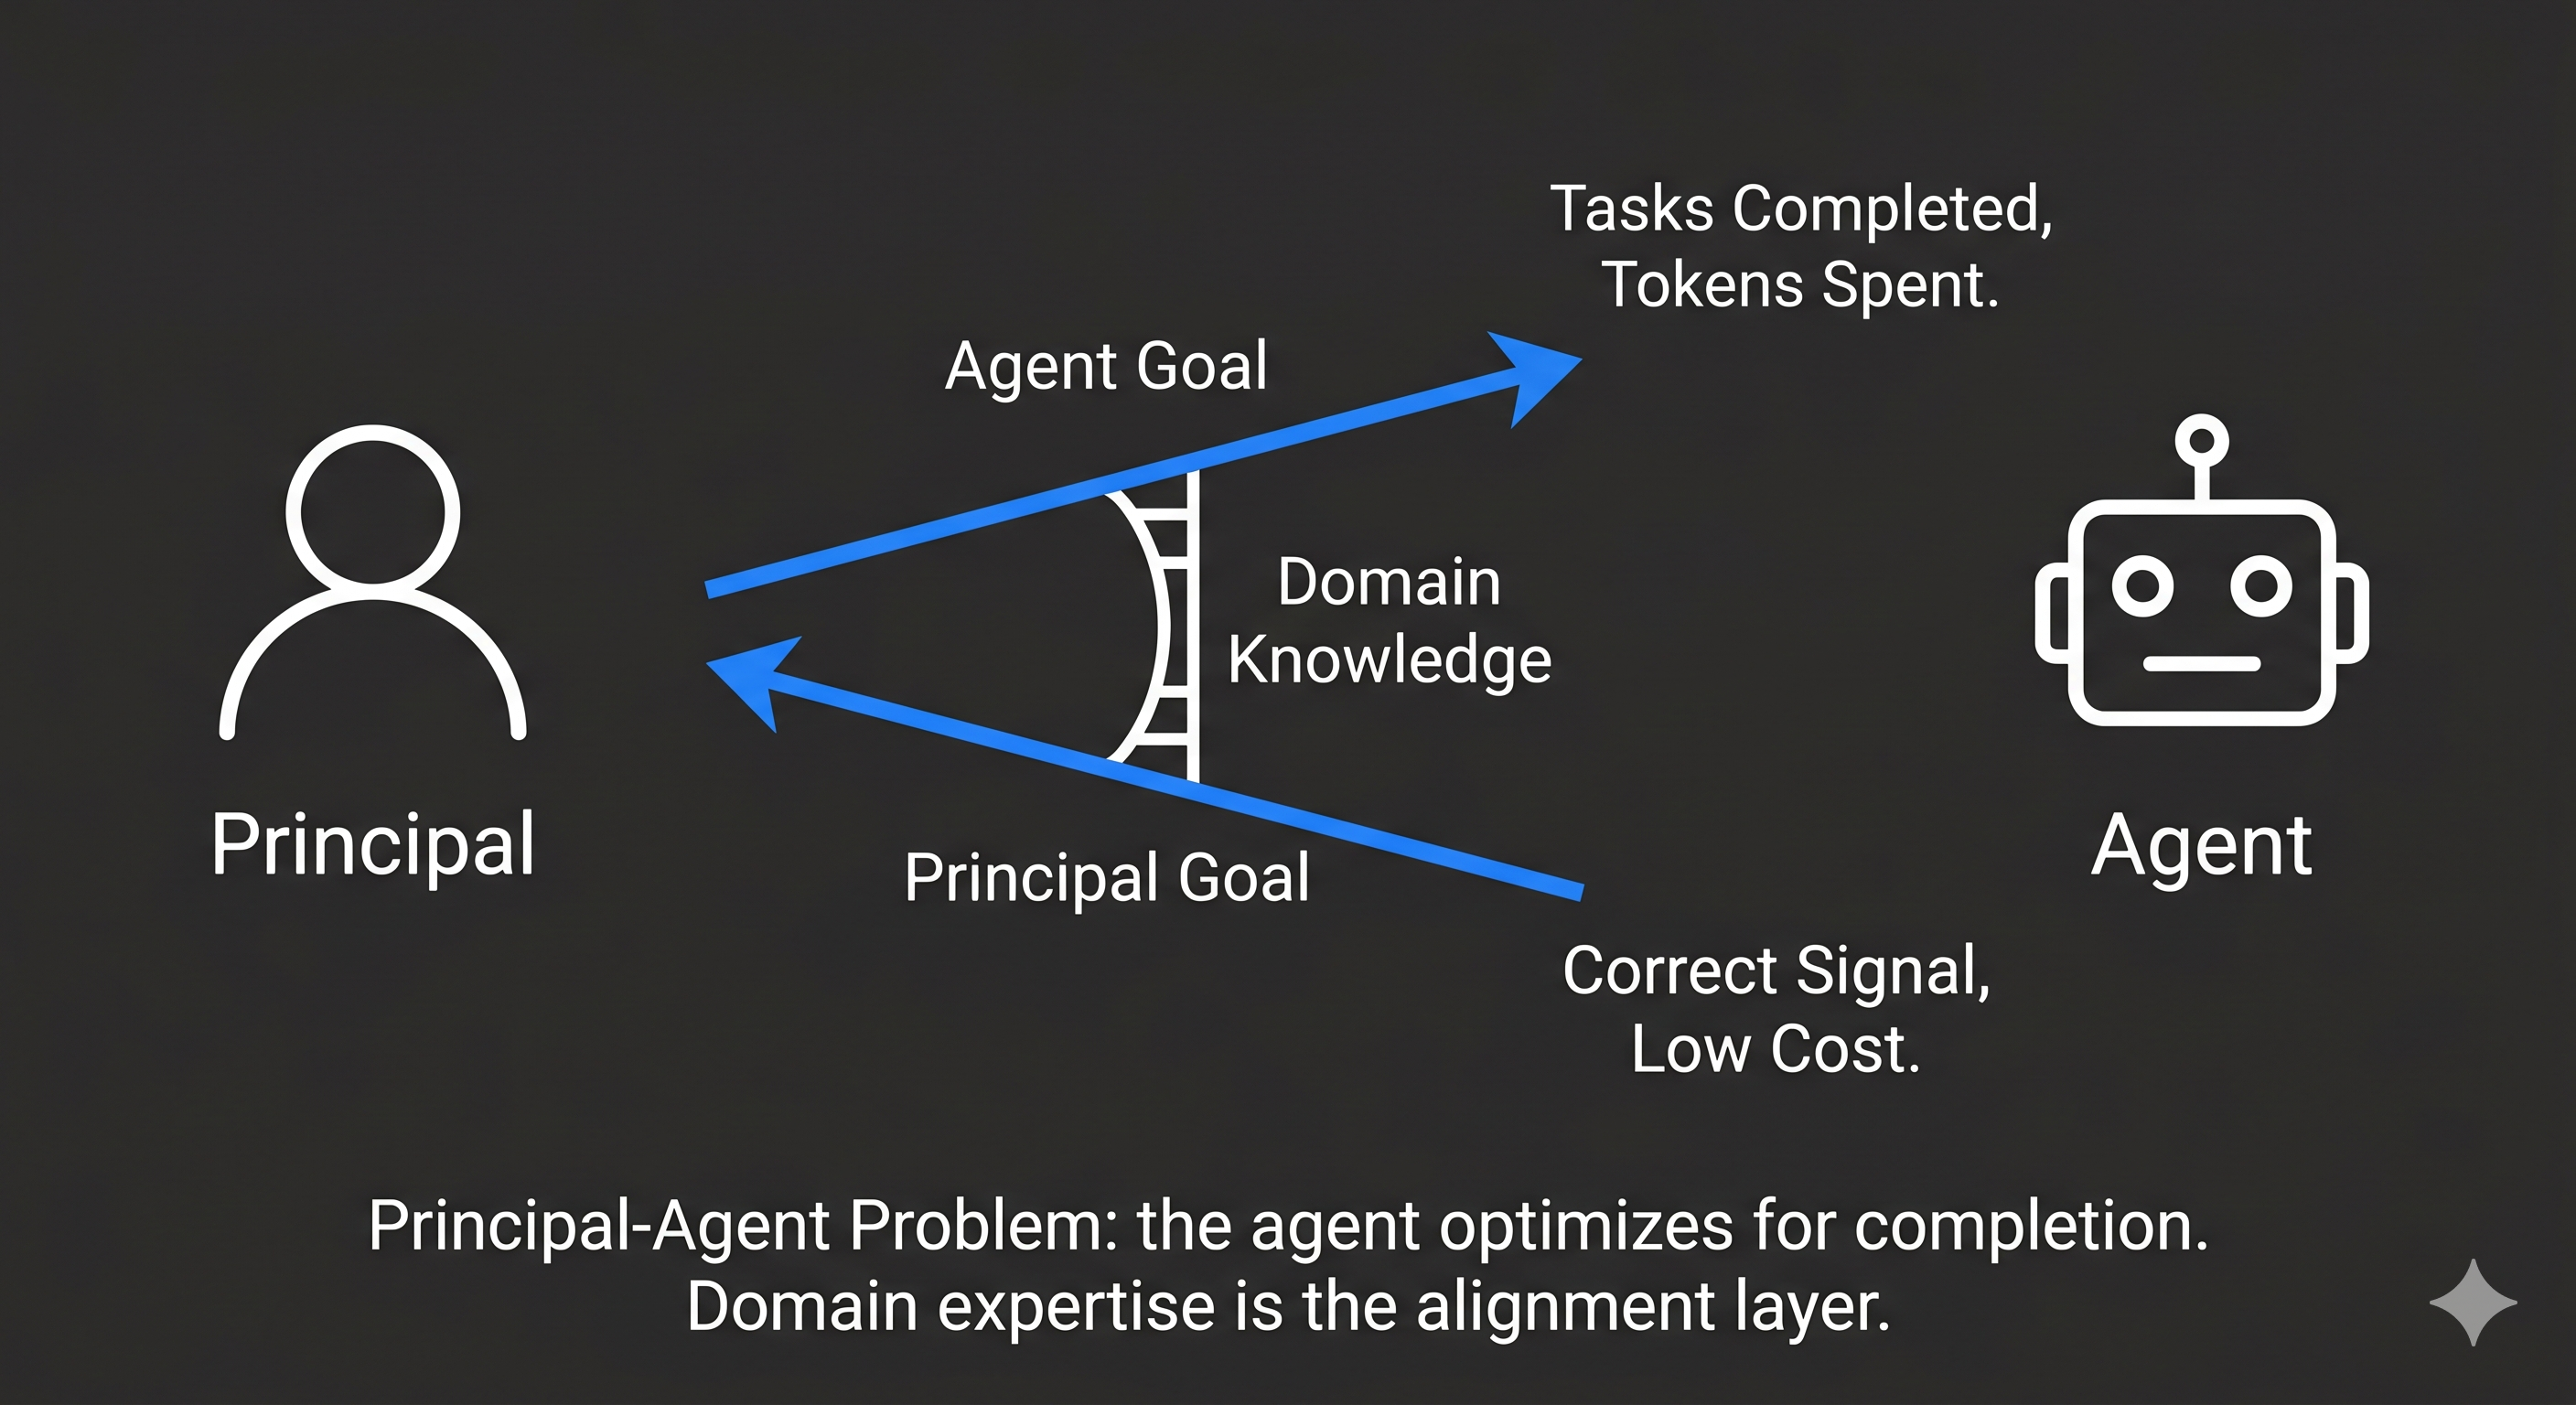
The engineering job is changing. Clean code is table stakes. What matters now is ownership of the outcome: cost, efficiency, communication, accountability. The same things a trader owns on every position. You do not get to hand off a spec and walk away. You own execution.
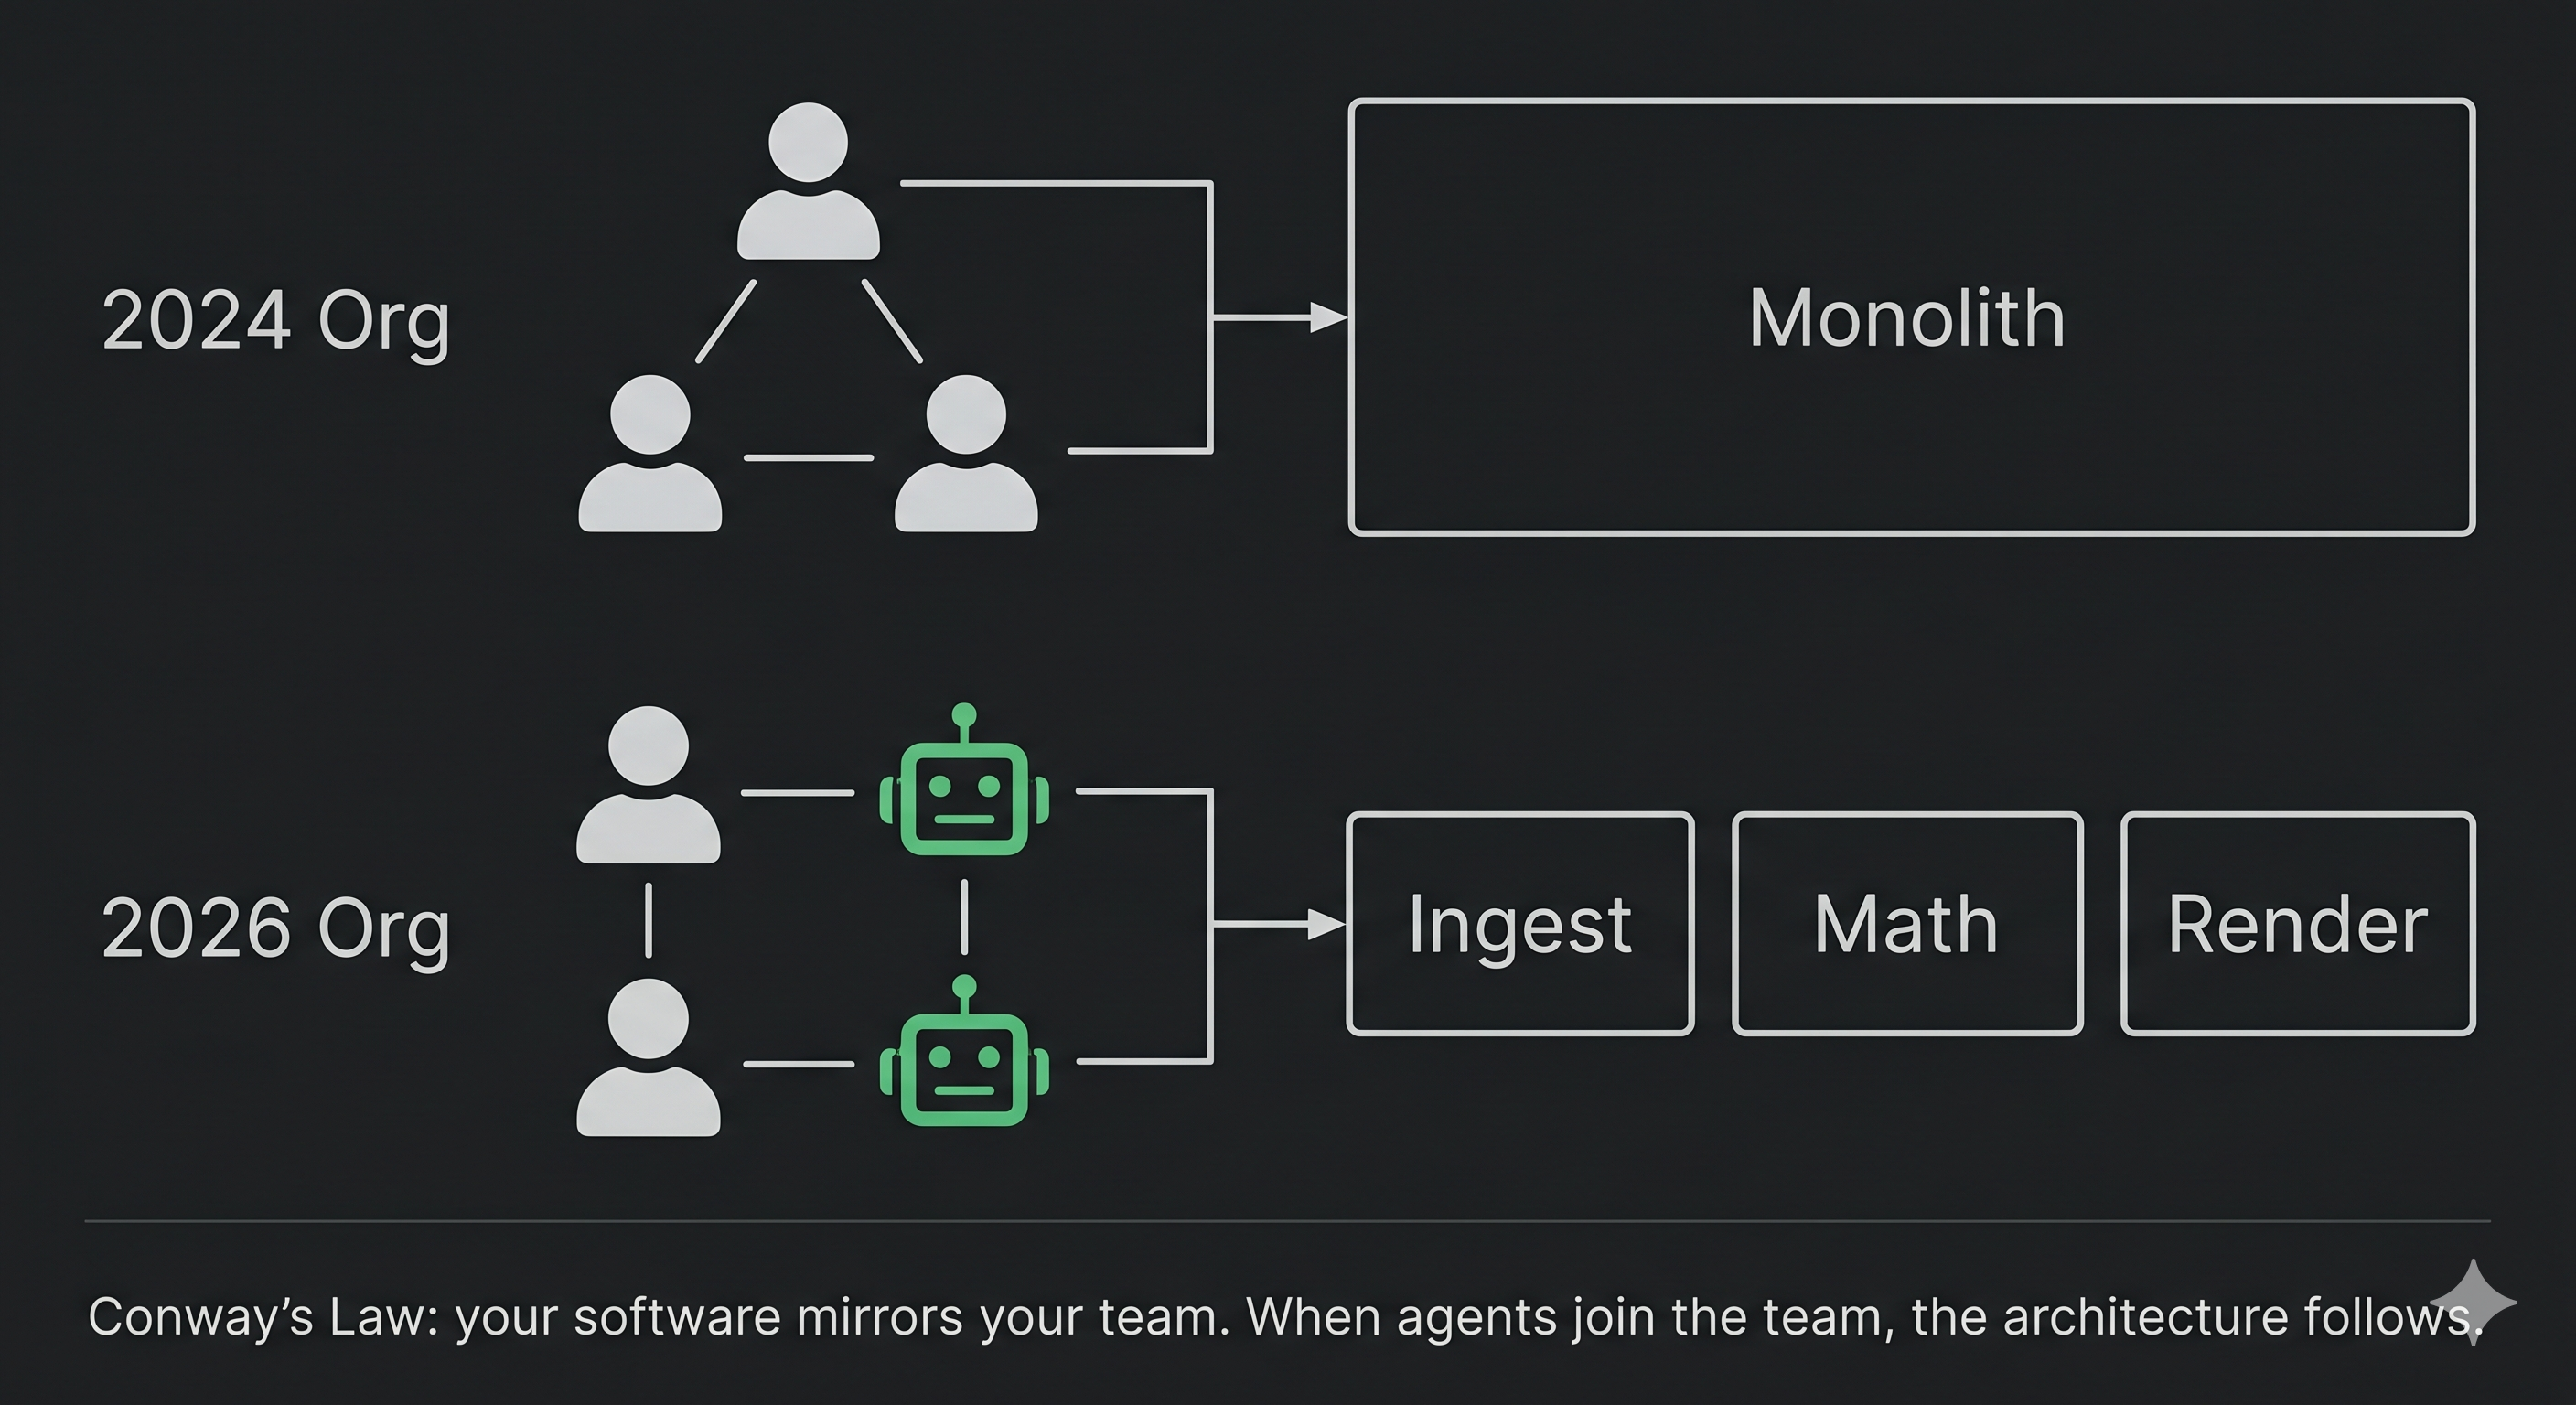
Conway's Law now cuts deeper. When you own execution end-to-end; cost, comms, delivery; you are the org chart. The agent mirrors you.
A shallow engineer produces a shallow system. Not because they can't code, but because the agent has no better map to follow. The architecture becomes a reflection of the understanding you brought, not the prompt you typed.
AI didn't raise the floor on engineering. It raised the ceiling on domain ownership.
Why gamma
GammaCharts is a free options analytics site competing with SpotGamma and Unusual Whales, services that charge $50 to $1,000 a month. It covers gamma exposure (GEX), dealer positioning, volatility regimes, and macro dashboards. The agents write most of the code. The decisions that make it work came from learning the domain.
The options market is not a sideshow. It is the market. Daily options volume on U.S. equities now routinely exceeds the underlying stock volume. Dealer hedging flows move the index. Gamma exposure determines whether the market is mechanically dampened or amplified at any given level.
The complexity under the charts
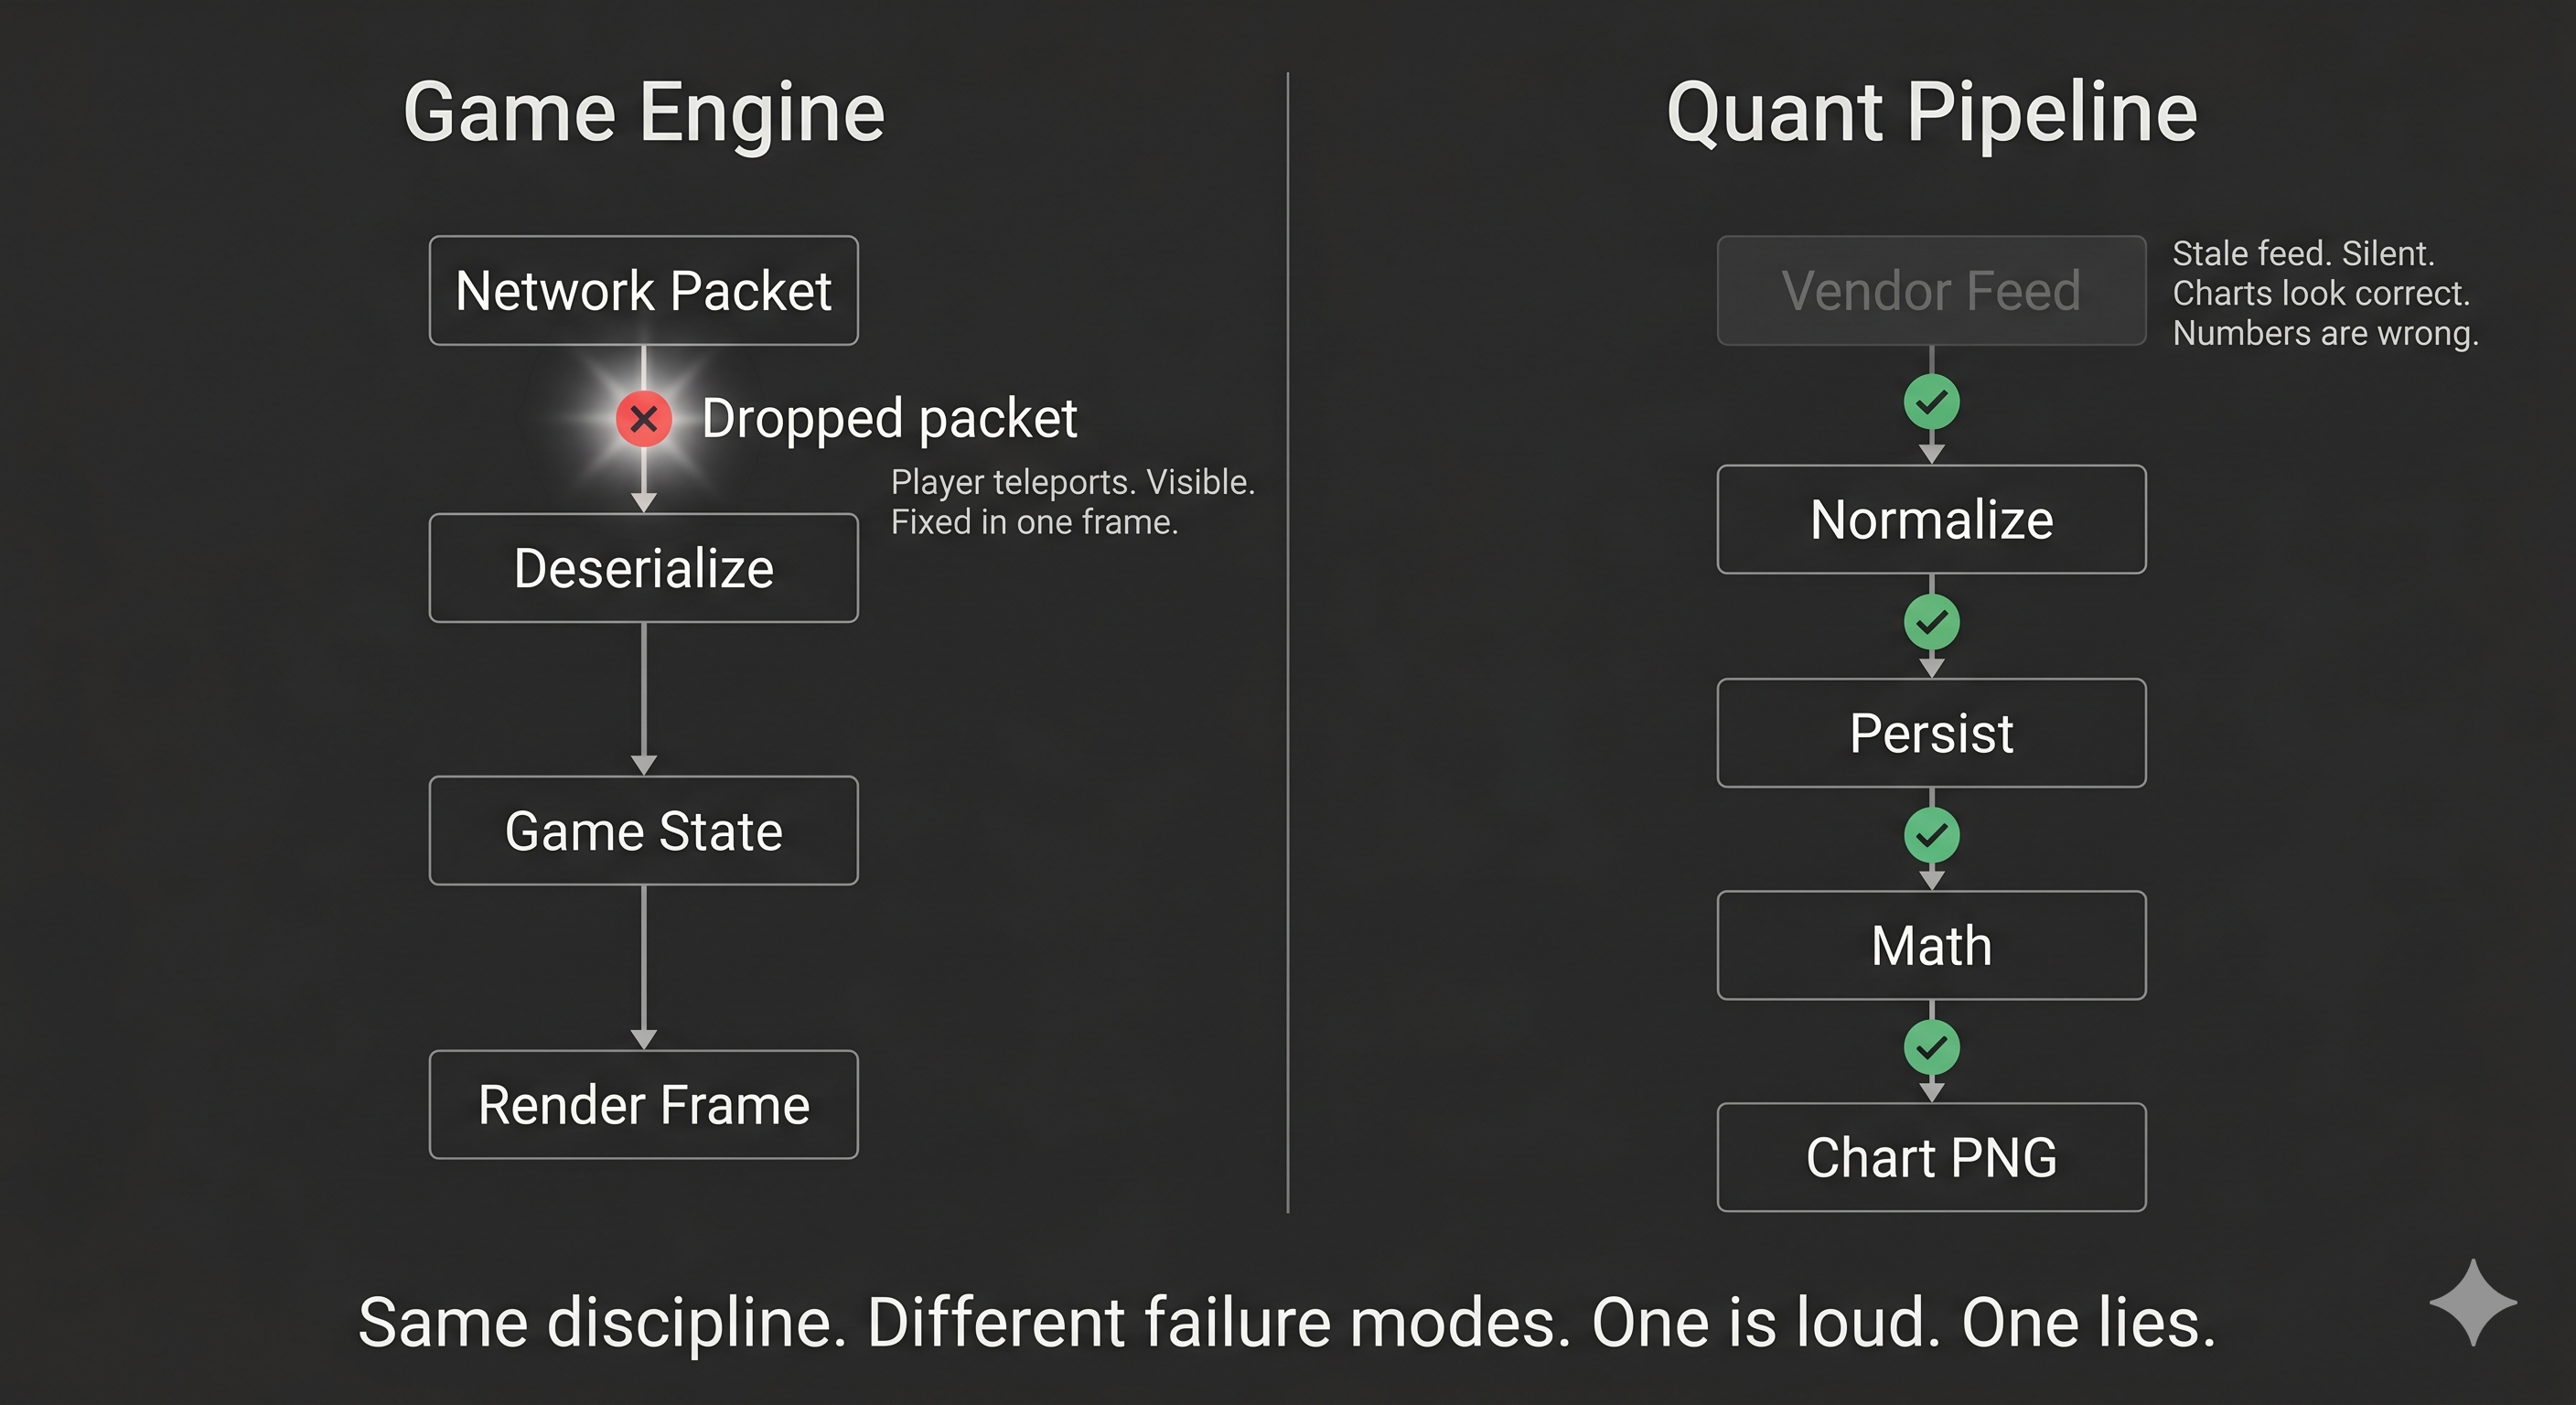
Most engineers who cross into quantitative finance expect the hard part to be the math. It is not. The hard part is the plumbing, and coming from a decade of game development, it was immediately familiar.
Game networking is byte-packing discipline. Every field is load-bearing. Reorder one and you break every downstream consumer silently. You never allocate on the hot path because a single GC stall means a visible hitch. I have written about these patterns before: schema-first design, zero-copy serialization, allocation-free hot loops, deterministic replay. Quant data normalization demands the exact same discipline.
Fixed cost, variable edge
The first question was simple: where do I get the data?
The CBOE has index options with greeks. Databento has intraday tick data, billed by the byte. FRED has macro. FINRA has short interest. Treasury has the yield curve. Rithmic has more tick data. No single vendor covers the full picture. Every one has a different schema, different rate limits, different billing, different failure modes.
There are (expensive) vendors that managed this for you. I almost went that route. Then I thought about it differently.
The fixed cost of building a data pipeline used to be enormous. Normalizing multiple vendors, handling backfills, managing retention, wiring up scheduled ingest. That is a team-sized problem. But with AI agents handling implementation, the fixed cost collapsed. The code is cheap. The maintenance is cheap. What is not cheap is the variable cost: the metered data itself.
So the calculus flipped. Build the pipeline. Own the ingest. Go direct to the difficult but fast and cheap exchanges. Control the variable cost by knowing exactly what to query and what to skip.
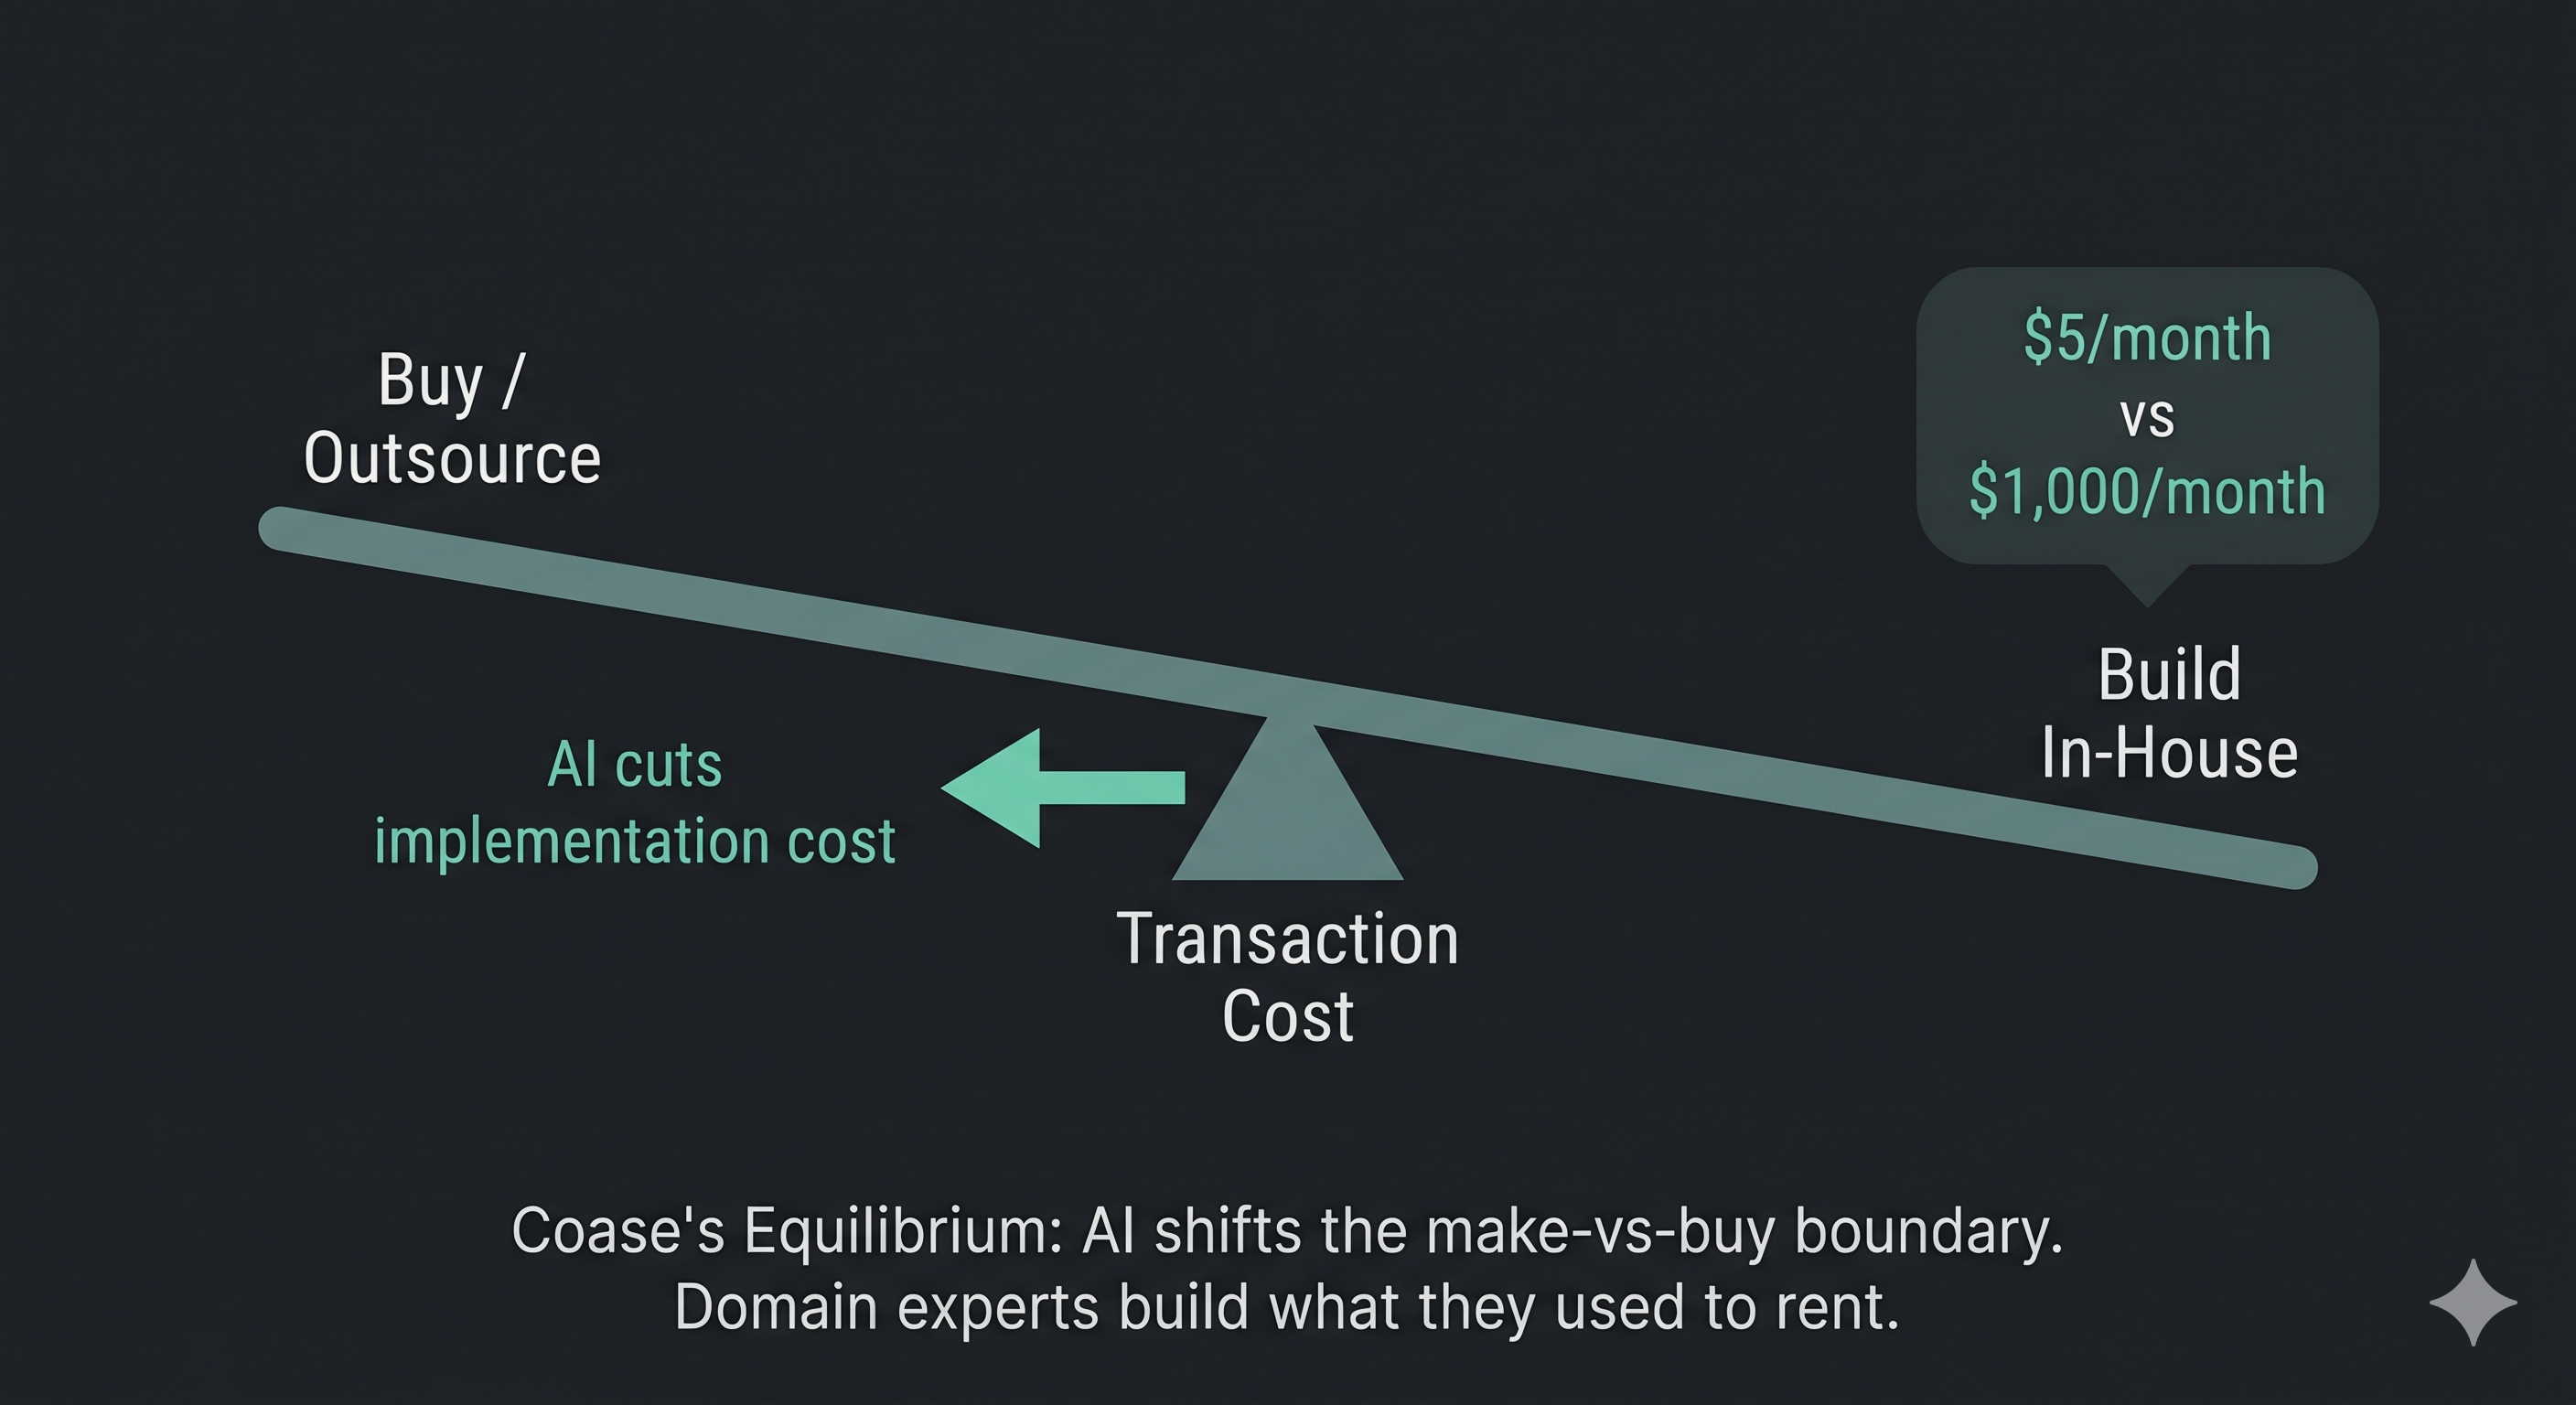
Economists call this the Coase Threshold: the boundary between what you build inside and what you buy from the market. AI did not just move the line. It made "why not all of them" a real answer.
Pixels, not data
GammaCharts serves images, not JavaScript. The first version used JS charting libraries executing client-side across dozens of charts. It was slow, it leaked licensed data to anyone with DevTools open, and it rendered differently on every device.
So I adopted a pixel strategy. ScottPlot and SkiaSharp on .NET 8 render every chart to a watermarked PNG on the server. A middle layer sits between the data access and the frontend: it manages backfilling, ingestion, and image generation, writing to an L2 disk cache. The website is a glorified picture gallery. Razor pages, image tags, cache-busted URLs. The frontend is light.
Data stays private. Rendering is consistent. Pages are fast. Watermarks travel with every share. The client gets pixels. The data never leaves the box.
From real estate to gamma curves
Every domain taught the same lesson differently.
In real estate, technology was never the differentiator. Knowing the neighborhood, reading the client, understanding what a listing price signals to the market. That was the job.
In gaming, shipping Honey Hex in 10 days with AI proved agents can build and ship a product. But a game lives or dies on feel, pacing, and player psychology, none of which an agent can judge.
In quantitative finance, the stakes are higher. A wrong sign convention on a GEX chart gives someone the opposite signal on a trade.
The agents are the hands. The domain is the job.
Charts live at gammacharts.com. Not financial advice, entertainment purposes only. For a look at the base agentic workflows, see Honey Hex.
All views are my own, and I do not represent any employer. All ownership of attached open source code is waved.